Wireshark PCAP analysis for humans and AI.
VisualEther turns a Wireshark capture into a sequence diagram you can read at a glance, then lets Claude Code answer 'why did it fail?' in plain English. Built for 5G developers, test engineers, and network professionals.
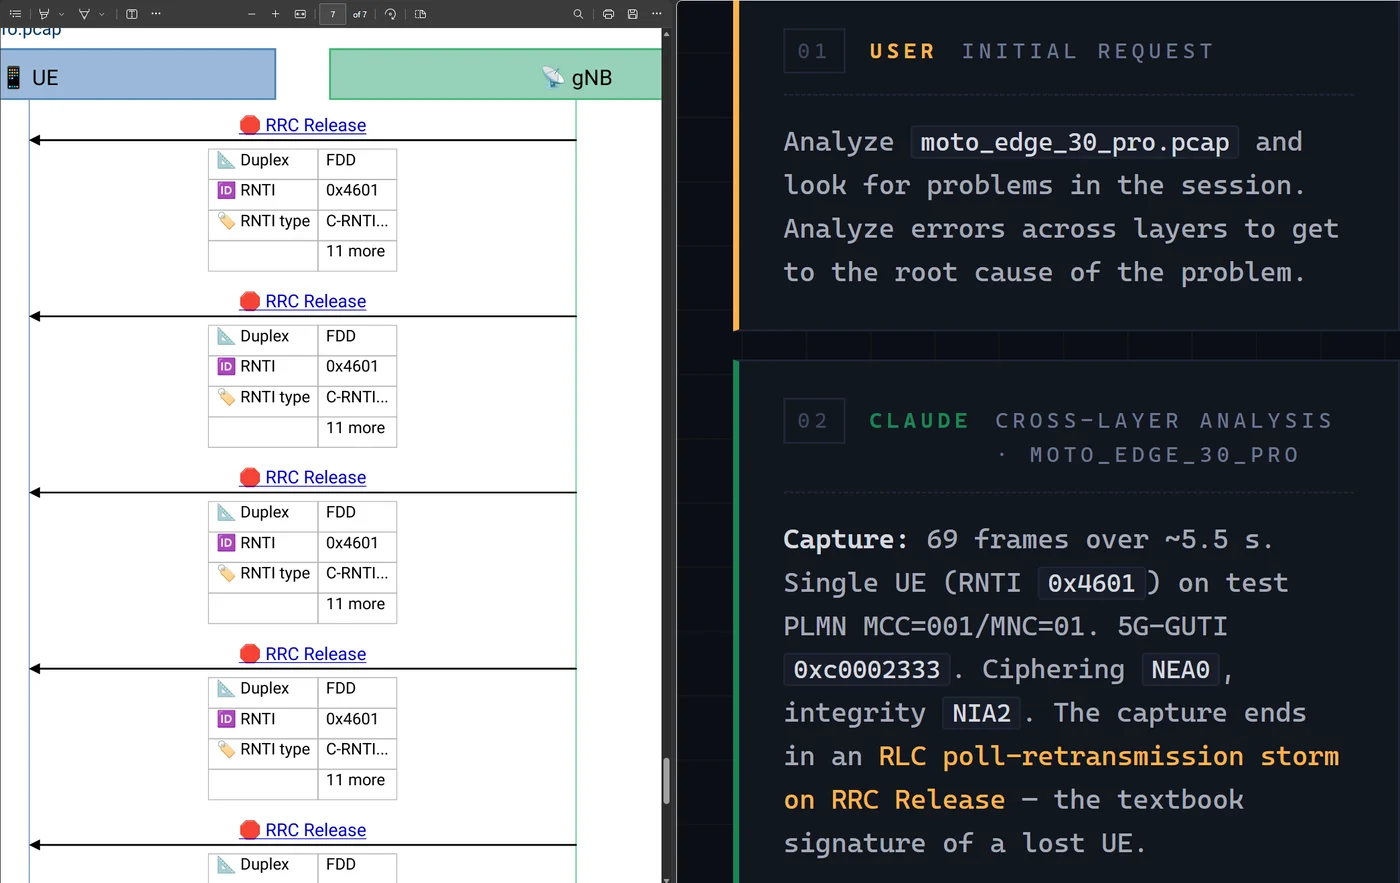
Wireshark shows the packets. You need the answer.
Whether you're chasing a 5G UE attach failure, certifying a BGP lab, validating a SIP trunk, or signing off a nightly regression — the capture has thousands of packets across multiple protocol layers. Wireshark gives you a flat list. You reconstruct the conversation in your head, then redraw it on a whiteboard for anyone who isn't fluent in Wireshark.
Here's the same capture, seen three ways:
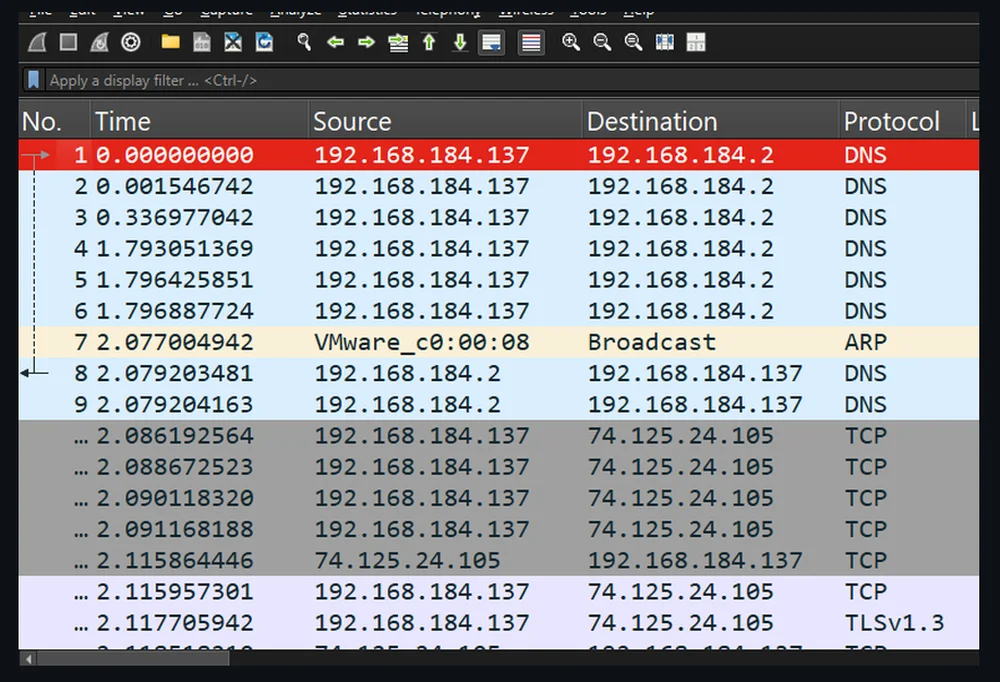
See · Wireshark
The raw capture — a flat packet list where a 2-second DNS stall is buried among 12,266 packets.
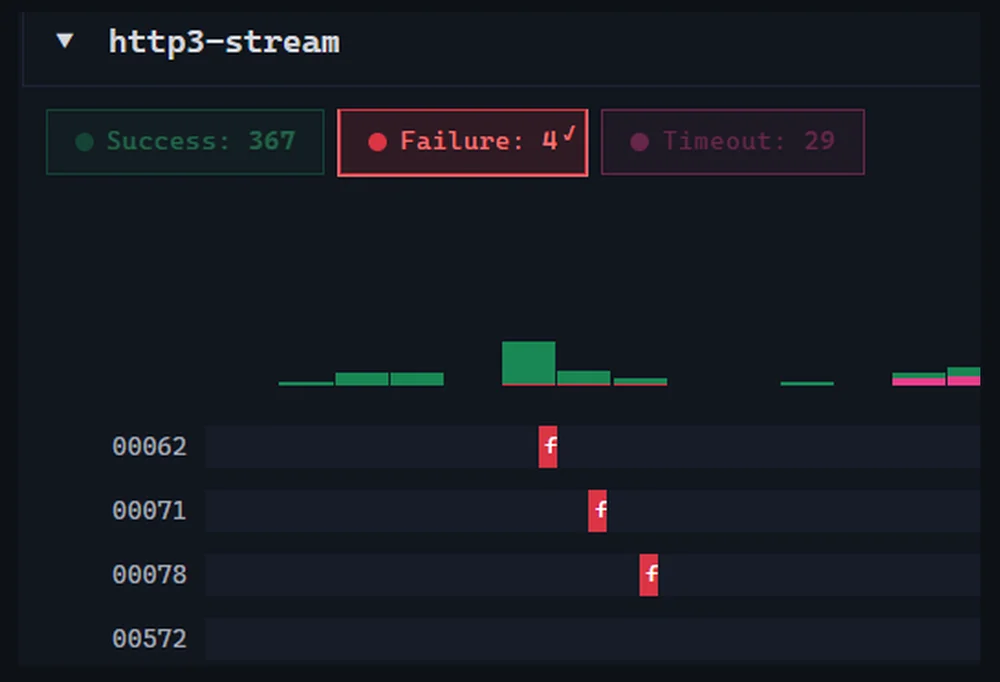
Triage · Session Navigator
The same capture grouped by outcome — the late and failed sessions surface first.
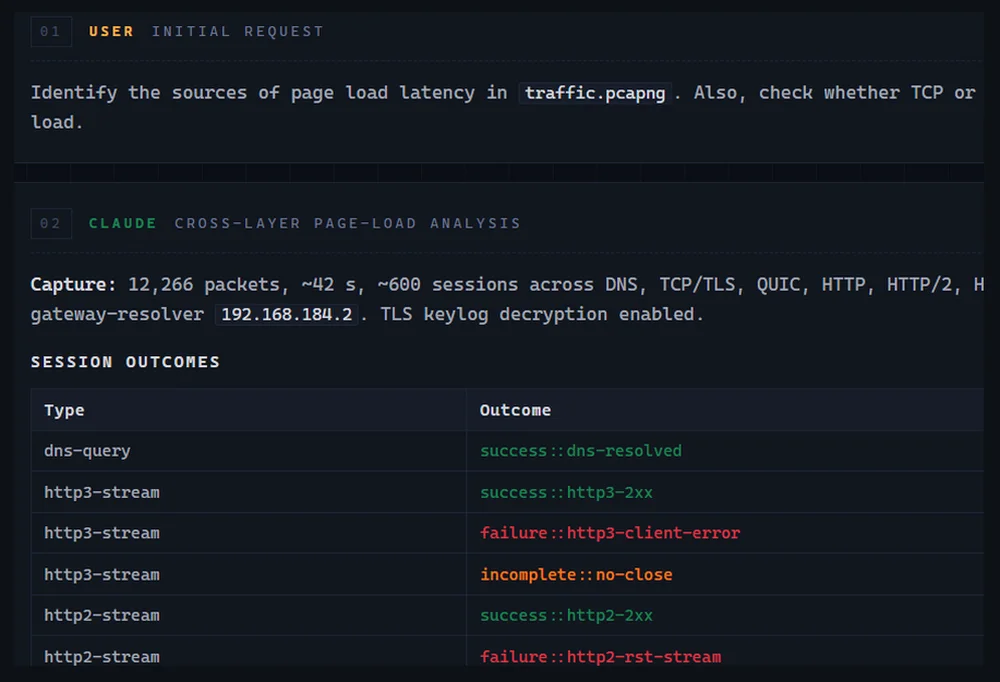
Diagnose · Claude Code
Claude answers in plain English: an upstream DNS forwarder stall — not TCP/QUIC loss — drives the latency.
See. Triage. Diagnose. Automate.
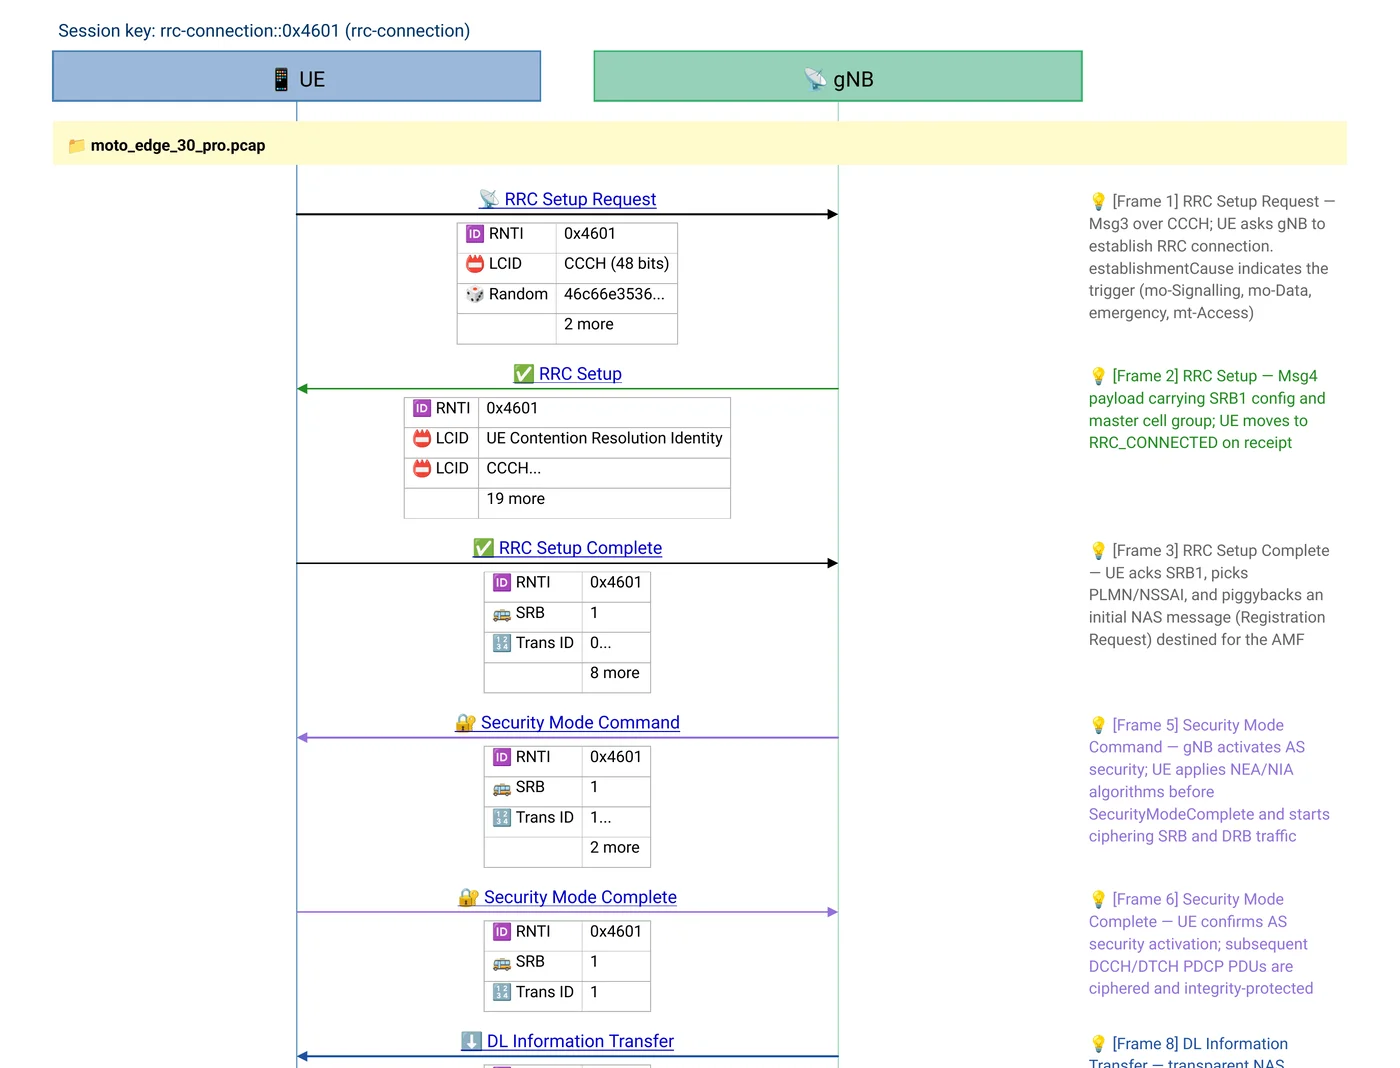
Sequence diagrams from PCAPs. For humans first.
Whether you're a 5G developer presenting a finding, a CCIE candidate writing up a lab, or a test engineer producing a post-mortem — a multi-layer protocol flow is a conversation between processes. Wireshark gives you the words; the conversation is implicit.
VisualEther draws the conversation directly from 82+ built-in protocol templates — 5G NR, 5G core, LTE, IMS / VoLTE, SIP / RTP, BGP, OSPF, DNS, HTTP/2, TLS, Kerberos, Diameter, GTP, Modbus, DNP3, EtherNet/IP. The PDF is the same picture your team would have drawn on a whiteboard — except it's frame-accurate, parameter-rich, and reproducible from the capture.
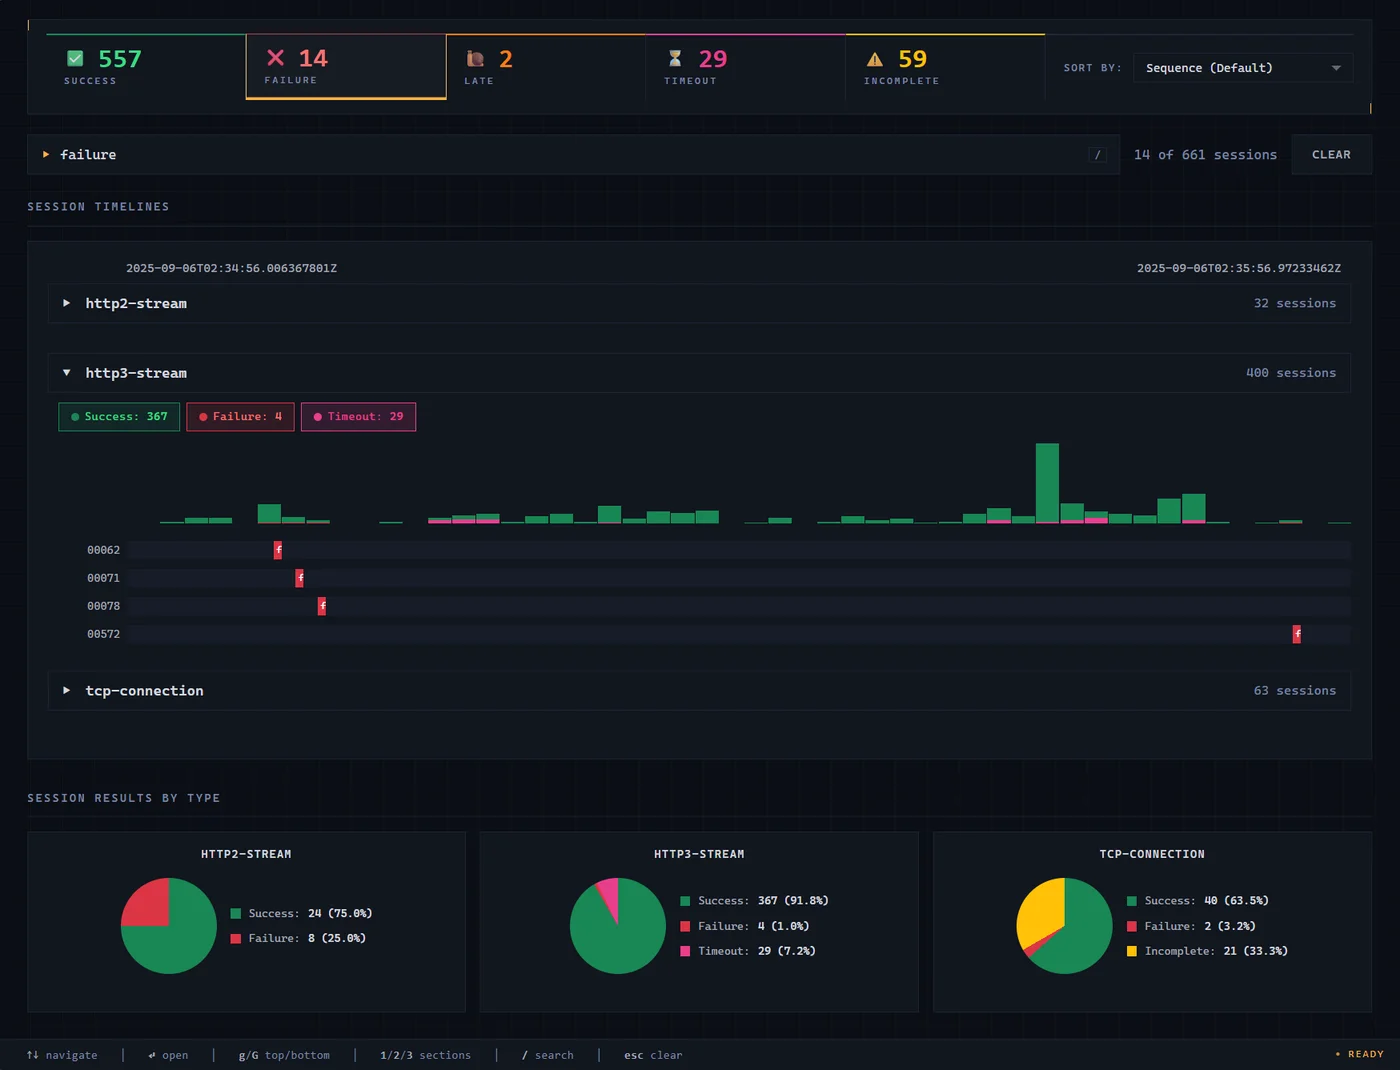
Find the broken session in a minute
It's Monday morning. Your weekend regression run produced 600 HTTP/3 sessions. You need to know which failed, and why, before standup at 10:00.
The Session Navigator organizes every session in the capture as a timeline, grouped by outcome — pass, fail, late, timeout, incomplete — so the broken flows are the first thing you see. Click a session and the Combined Viewer pairs the sequence diagram with an expandable Wireshark-style packet tree: one click goes from arrow to bit-level field.
Stop guessing why a session failed. Just ask Claude.
The problem with using AI for packet analysis is scale: a typical PCAP has thousands of packets with dozens of fields per layer, and dumping it into a chat window blows the context budget before you've finished pasting. VisualEther extracts only the messages and fields that matter, so Claude Code (via the Model Context Protocol) reads kilobytes of structured data, not megabytes of raw logs.
Point it at a capture and it runs the full author → debug → verify loop:
- Authors the recipe — detects the protocols, generates the extraction template, and validates it against the PCAP until it fits.
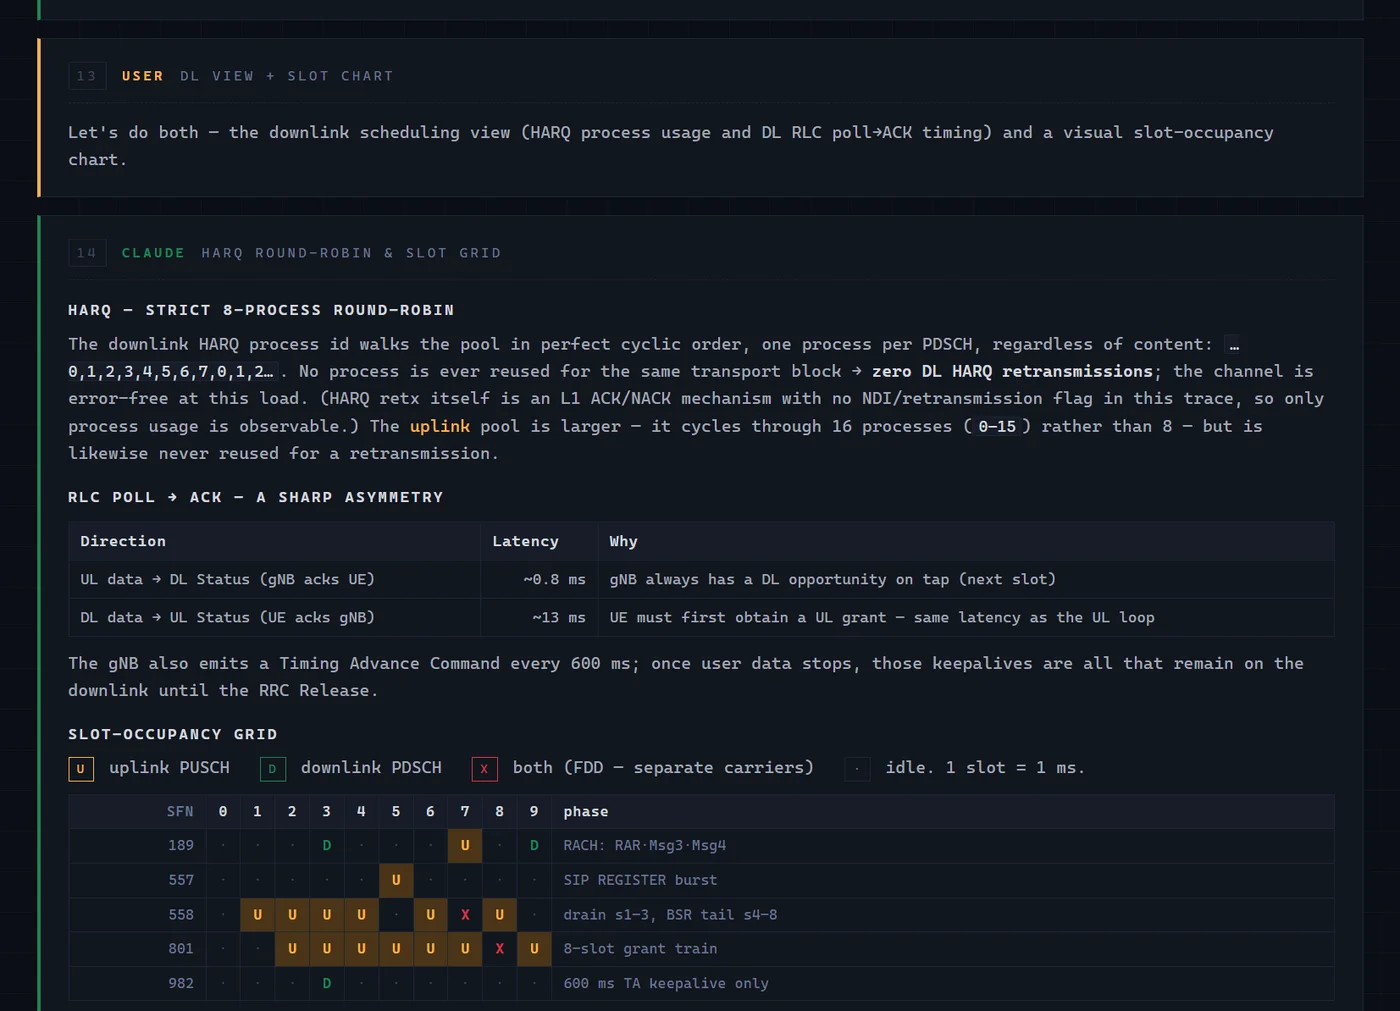
- Debugs the failure — correlates across layers and compares pass against fail: "twelve RRC Release retransmissions across MAC, RLC, PDCP, and RRC in 414 ms, traced to a Power Headroom of −8 dB."
- Verifies the fix — re-analyzes the next capture through the VisualEther MCP and confirms the broken flow comes back clean.
Pin the analysis down. Run it forever in your test pipeline.
The first capture is interactive. The hundredth runs unattended at 3 AM.
Scaffold the project once — templates, hostnames, config — and commit it with your test scripts. Every capture from that rig gets the same analysis with one command. Wire it into Jenkins or GitLab CI and each PR gets its sequence diagram automatically.
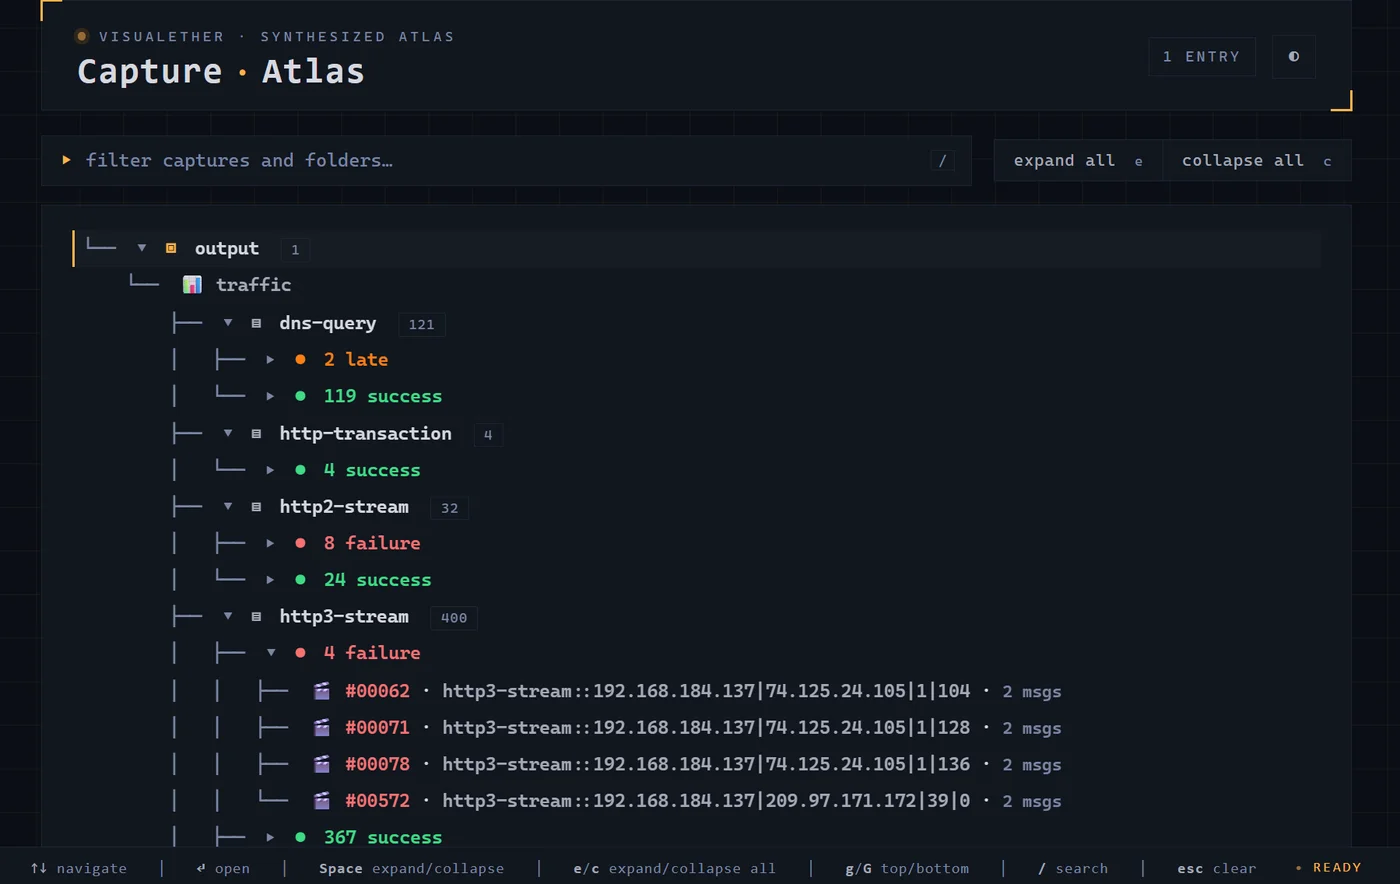
A batch lands in a Capture Atlas — one tree-view page linking every diagram, with machine-readable output beside it for a regression dashboard or a pass/fail gate. Even multi-megabyte ring-buffer captures open instantly; diagrams render on demand.
See it work end-to-end in 2 minutes
Point Claude Code at a capture and ask one question. In this real 5G NR trace, VisualEther recognizes the whole stack, splits it by layer, and Claude drives past the obvious symptom to the actual root cause — with frame numbers as evidence. It's the four capabilities above, running on one capture.
See the output on real captures
Interactive Capture Atlases, rendered straight from real Wireshark PCAPs — open one and drill from the capture tree into any session as a sequence diagram or a PDF. This is the raw output; the case studies below add Claude's narrated analysis on top.
See Claude debug real captures
These are the captures where Wireshark's flat packet list leaves you stuck — an encrypted 5G user plane, a nightly run that tangles five protocols together, auth traffic that might be an attack. Each case study below is a verbatim Claude Code session on a real capture: it opens with the question you'd actually be asking, and ends with a frame-anchored answer Claude wrote from the data.
Editions
One download, three editions. Install VisualEther and it runs as the free Community edition with no license. Add a license — a free 45-day trial or a paid one — and the same install unlocks Professional features. The trial enables the full paid feature set, so you can evaluate everything before choosing Professional or Server.
Community
Free. PDF sequence diagrams from any PCAP. Best for individual learning and small captures up to 10 pages.
Professional
One developer. AI-driven analysis via Claude Code, browser-based session triage, unlimited pages, up to 64 entities per diagram.
Server
Three developers plus one shared CI / VM / server install. Built for test teams running regression captures unattended.